Prometheus 监控实战系列 13:收工实战:业务全栈监控之 Tornado 应用与中间件完整监控方案
在Kubernetes监控体系中,针对业务应用的全栈监控是落地可观测性的核心环节。本文将以Clojure编写、运行在JVM上的Tornado REST-ful API应用为实战对象,完整讲解如何基于Prometheus实现MySQL、Redis中间件+Tornado业务应用的全栈监控方案,核心依托边车(Sidecar)模式 完成监控能力的落地。
一、核心架构:边车(Sidecar)模式解析
边车模式是Kubernetes中实现应用监控的经典架构模式,其核心逻辑是:将监控组件(如Prometheus Exporter)作为“边车”容器,与业务容器部署在同一个Pod中,共享网络和生命周期,为业务容器提供监控数据采集的支撑能力。
简单来说,业务容器是“摩托车”,边车容器是“挂在摩托车旁的边车”——边车容器专注于监控、日志等基础设施能力,不侵入业务代码,且与业务容器同生共灭。 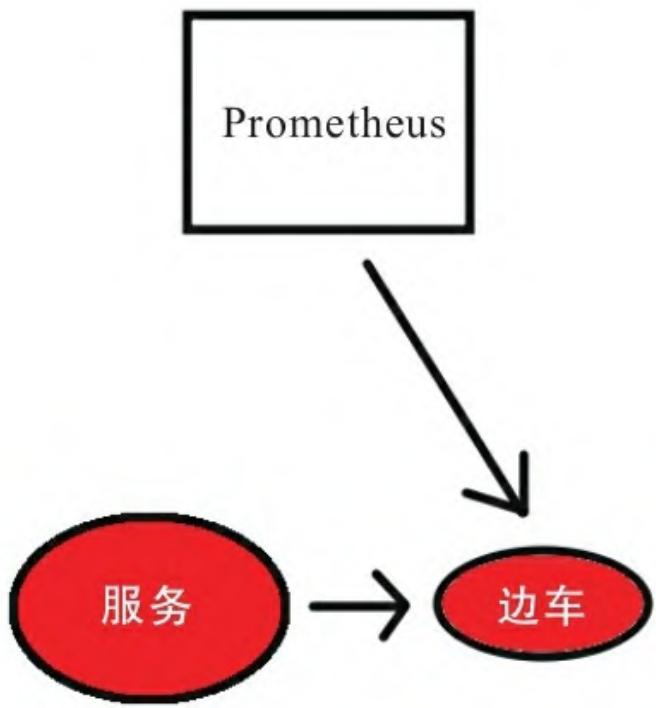 图13-1 边车模式
在本次实战中,MySQL、Redis的监控均通过“业务容器+Exporter边车容器”的模式实现,Tornado API则通过代码埋点暴露Prometheus指标,最终所有监控数据均由Prometheus统一抓取、分析并触发告警。
二、实战1:MySQL监控(Exporter边车+权限配置+告警规则)
2.1 部署MySQL Exporter边车容器
在Kubernetes的MySQL Deployment中,新增Prometheus官方的mysqld-exporter作为边车容器,核心配置如下:
- image: prom/mysqld-exporter:latest
  name: tornado-db-exp
  args:
    --collect.info_schema.innodb_metric
    --collect.info_schema.userstats
    --collect.perf_schema.eventsstatement
    --collect.perf_schema.indexiowaits
    --collect.perf_schema.tableiowaits
  env:
    - name: DATA_SOURCE_NAME
      value: "tornado-db-exp:anotherstrongpassword@(tornado-db):3306)/"
  ports:
    - containerPort: 9104
      name: tornado-db-exp
关键配置说明:
- 镜像:使用Prometheus官方
prom/mysqld-exporter,默认暴露9104端口; - 环境变量
DATA_SOURCE_NAME:通过DSN格式配置MySQL连接信息(用户名、密码、地址、端口); - 采集参数:启用
info_schema/perf_schema相关采集器,获取MySQL性能、索引、表IO等核心指标。
2.2 配置MySQL监控用户权限
Exporter需要有限权限才能采集MySQL指标,需创建专用用户并授予PROCESS、REPLICATION CLIENT、SELECT权限:
- 进入MySQL容器:
kubectl exec -ti <mysql-pod名称> -- /usr/bin/mysql -p- 创建用户并授权:
CREATE USER 'tornado-db-exp'@'localhost' IDENTIFIED BY 'anotherstrongpassword';
GRANT PROCESS, REPLICATION CLIENT, SELECT ON *.* TO 'tornado-db-exp';
GRANT SELECT ON performance_schema.* TO 'tornado-db-exp';
2.3 暴露MySQL监控端点(K8s Service)
通过Kubernetes Service暴露Exporter端口,并添加Prometheus自动发现注解:
apiVersion: v1
kind: Service
metadata:
  name: tornado-db
  annotations:
    prometheus.io/scrape: 'true'
    prometheus.io/port: '9104'
spec:
  selector:
    app: tornado-db
  type: ClusterIP
  ports:
    - port: 3306
      name: tornado-db
    - port: 9104
      name: tornado-db-exp
注解说明:
prometheus.io/scrape: 'true':告诉Prometheus“需要抓取该服务的指标”;prometheus.io/port: '9104':指定Prometheus抓取的端口(Exporter端口,非MySQL端口)。
2.4 MySQL核心监控规则与告警
基于Google“四个黄金指标”(延迟、流量、错误、饱和度),设计MySQL核心监控规则:
(1)慢查询率告警
- alert: MySQLHighSlowQueryRate
  expr: rate(mysql_global_status_slow_queries[2m]) > 5
  labels:
    severity: warning
  annotations:
    summary: MySQL Slow query rate is exceeded on {{ $labels.instance }} for {{ $labels.kubernetes_name }}
(2)中止连接数告警
- alert: MySQLAbortedConnectionsHigh
  expr: rate(mysql_global_status_aborted_connects[2m]) > 5
  labels:
    severity: warning
  annotations:
    summary: MySQL Aborted connection rate is exceeded on {{ $labels.instance }} for {{ $labels.kubernetes_name }}
(3)MySQL服务可用性告警
- alert: TornadoDBServerDown
  expr: mysql_up{kubernetes_name="tornado-db"} == 0
  for: 10m
  labels:
    severity: critical
  annotations:
    summary: MySQL Server {{ $labels.instance }} is down!
- alert: TornadoDBServerGone
  expr: absent(mysql_up{kubernetes_name="tornado-db"})
  for: 10m
  labels:
    severity: critical
  annotations:
    summary: No Tornado DB servers are reporting!
  description: The Tornado MySQL server is completely unavailable.
(4)请求速率记录规则(辅助分析)
- record: mysql/write_requests:rate2m
  expr: sum(rate(mysql_global_status_Commands_total{command=~"insert|update|delete"}[2m])) without (command)
- record: mysql/select_requests:rate2m
  expr: sum(rate(mysql_global_status_Commands_total{command="select"}[2m]))
- record: mysql/total_requests:rate2m
  expr: rate(mysql_global_status_Commands_total[2m])
- record: mysql/top5_statements:rate5m
  expr: topk(5, sum by (schema,digest_text) (rate(mysql_perf_schema_events_statements_total[5m])))
三、实战2:Redis监控(Exporter边车+缓存/连接告警)
3.1 部署Redis Exporter边车容器
与MySQL监控逻辑一致,在Redis Deployment中添加oliver006/redis_exporter作为边车容器:
apiVersion: apps/v1beta2
kind: Deployment
...
- name: redis-exporter
  image: oliver006/redis_exporter:latest
  env:
    - name: REDIS_ADDR
      value: redis://tornado-redis:6379
    - name: REDIS_PASSWORD
      value: tornadoapi
  ports:
    - containerPort: 9121
关键配置:
- 镜像:
oliver006/redis_exporter是社区主流的Redis Exporter; - 环境变量:
REDIS_ADDR指定Redis地址,REDIS_PASSWORD指定Redis连接密码; - 端口:默认暴露9121端口用于指标采集。
3.2 暴露Redis监控端点(K8s Service)
apiVersion: v1
kind: Service
metadata:
  name: tornado-redis
  annotations:
    prometheus.io/scrape: 'true'
    prometheus.io/port: '9121'
spec:
  selector:
    app: tornado-redis
  ports:
    - port: 6379
      name: redis
    - port: 9121
      name: redis-exporter
  clusterIP: None
3.3 Redis核心监控告警规则
(1)缓存未命中率过高告警
- alert: TornadoRedisCacheMissesHigh
  expr: redis_keyspace_misses_total / (redis_keyspace_hits_total + redis_keyspace_misses_total) > 0.8
  for: 10m
  labels:
    severity: warning
  annotations:
    summary: Redis Server {{ $labels.instance }} Cache Misses are high.
(2)连接拒绝数过高告警(最大连接数超限)
- alert: RedisRejectedConnectionsHigh
  expr: avg(redis_rejected_connections_total) by (addr) > 10
  for: 10m
  labels:
    severity: warning
  annotations:
    summary: "Redis instance {{ $labels.addr }} may be hitting maxclient limit."
    description: "The Redis instance at {{ $labels.addr }} had {{ $value }} rejected connections during the last 10m and may be hitting the maxclient limit."
(3)Redis服务可用性告警
- alert: TornadoRedisServerDown
  expr: redis_up{kubernetes_name="tornado-redis"} == 0
  for: 10m
  labels:
    severity: critical
  annotations:
    summary: Redis Server {{ $labels.instance }} is down!
- alert: TornadoRedisServerGone
  expr: absent(redis_up{kubernetes_name="tornado-redis"})
  for: 10m
  labels:
    severity: critical
  annotations:
    summary: No Tornado Redis servers are reporting!
  description: The Tornado Redis server is completely unavailable.
四、实战3:Tornado API监控(Clojure应用埋点+指标导出)
Tornado是基于Clojure编写的JVM应用,需通过代码埋点的方式暴露Prometheus指标,核心依赖iapetos(Clojure的Prometheus客户端)实现。
4.1 引入依赖(project.clj)
(defproject tornado-api-prometheus "0.1.0-SNAPSHOT"
  :description "Example Clojure REST service for Prometheus monitoring"
  :url "http://artofmonitoring.com"
  :dependencies [
    [org.clojure/clojure "1.8.0"]
    [iapetos "0.1.8"]
    [io.prometheus/simpleclient_hotspot "0.4.0"]
  ]
  :plugins [[lein-ring "0.7.3"]]
)
关键依赖:
iapetos:Clojure的Prometheus客户端,用于定义/导出指标;simpleclient_hotspot:导出JVM核心指标(线程、内存、GC等)。
4.2 定义指标注册表
创建指标注册表,初始化JVM、Ring(Clojure Web框架)指标,并自定义业务指标:
(ns tornado-api.handler
  (:require [compojure.handler :as handler]
            [iapetos.core :as prometheus]
            [iapetos.collector.ring :as ring]
            [iapetos.collector.jvm :as jvm]))

; 定义指标注册表,全局唯一
(defonce registry
  (-> (prometheus/collector-registry)
      (jvm/initialize)  ; 初始化JVM指标采集
      (ring/initialize) ; 初始化Ring HTTP指标采集
      ; 注册自定义业务指标
      (prometheus/register
        (prometheus/counter :tornado/item-get {:description "Total items queried"})
        (prometheus/counter :tornado/item-bought {:description "Total items bought"})
        (prometheus/counter :tornado/item-sold {:description "Total items sold"})
        (prometheus/counter :tornado/update-item {:description "Total items updated"})
        (prometheus/gauge :tornado/up {:description "Tornado API health status (1=up, 0=down)"}))))

; 初始化up指标为1(应用启动即标记为可用)
(prometheus/set (registry :tornado/up) 1)
4.3 业务代码埋点(递增计数器)
在API接口的业务逻辑中,调用prometheus/inc递增对应计数器,例如“购买商品”接口:
(defn buy-item [item]
  (let [id (uuid)]
    (sql/db-do-commands db-config
      (let [item (assoc item "id" id)]
        (sql/insert! db-config :items item)
        ; 递增“商品购买”计数器
        (prometheus/inc (registry :tornado/item-bought))))
    (wcar* (car/ping) (car/set id (item "title")) (get-item id))))
4.4 暴露/metrics端点
通过Ring中间件暴露/metrics端点,用于Prometheus抓取:
(def app
  (-> (handler/api app-routes)
      (middleware/wrap-json-body)
      (middleware/wrap-json-response)
      ; 挂载指标导出中间件,路径为/metrics
(ring/wrap-metrics registry {:path "/metrics"})))访问/metrics可看到三类指标:
- 自定义业务指标(如
tornado_item_bought); - JVM指标(如
jvm_threads_peak); - Ring HTTP指标(如
http_request_latency_seconds)。
4.5 Tornado API监控规则与告警
(1)平均请求延迟记录规则
- record: tornado:request_latency_seconds:avg
  expr: http_request_latency_seconds_sum{status="200"} / http_request_latency_seconds_count{status="200"}
(2)请求延迟过高告警(90分位值)
- alert: TornadoRequestLatencyHigh
  expr: histogram_quantile(0.9, rate(http_request_latency_seconds_bucket{kubernetes_name="tornado-api"}[5m])) > 0.05
  for: 10m
  labels:
    severity: warning
  annotations:
    summary: API Server {{ $labels.instance }} latency is over 0.05s (90th percentile).
(3)Tornado API可用性告警
- alert: TornadoAPIServerDown
  expr: tornado_up{kubernetes_name="tornado-api"} != 1
  for: 10m
  labels:
    severity: critical
  annotations:
    summary: API Server {{ $labels.instance }} is down!
- alert: TornadoAPIServerGone
  expr: absent(tornado_up{kubernetes_name="tornado-api"})
  for: 10m
  labels:
    severity: critical
  annotations:
    summary: No Tornado API servers are reporting!
  description: The Tornado API server is completely unavailable.
五、总结
本文以Tornado业务应用为核心,完整落地了“MySQL+Redis中间件(边车模式)+Tornado API(代码埋点)”的全栈监控方案,核心要点:
- 边车模式是Kubernetes中中间件监控的最优实践,无侵入、易扩展;
- MySQL/Redis监控需关注“可用性+核心性能指标(慢查询、缓存命中率、连接数)”;
- JVM应用监控需结合“通用JVM指标+业务自定义指标”,覆盖应用健康度和业务行为;
- 告警设计需贴合“四个黄金指标”,兼顾可用性、性能、错误率维度。
该方案可直接复用至其他Kubernetes上的业务应用监控场景,只需根据中间件类型替换Exporter、根据开发语言替换Prometheus客户端即可。