《Go Cookbook CN》系列 19:基准测试全解——从基础使用到性能剖析
本文聚焦Go语言中基准测试的全流程落地与深度剖析,从基准测试的基础概念入手,逐步讲解自动化性能测试编写、测试执行策略、测试夹具规避、运行时长控制、多测试用例设计、测试结果对比,最终延伸至程序性能剖析,帮助读者掌握Go性能测试的核心方法与优化思路,实现从基准测试编写到性能瓶颈定位的全链路能力。
【本篇核心收获】
- 掌握Go基准测试函数的编写规范与
go test工具的基础使用方法 - 学会精准控制性能测试执行范围,规避测试夹具对结果的干扰
- 能够灵活调整基准测试运行时长/迭代次数,设计多场景子基准测试
- 运用
benchstat工具对比分析性能测试结果,判断代码性能变化 - 借助
pprof工具完成程序CPU性能剖析,定位核心性能瓶颈
2.1 基准测试核心认知
性能测试是软件测试的重要非功能性测试模块,其核心目标并非验证软件功能是否符合预期,而是测试软件在特定工作负载下的稳定性、速度和可扩展性。
在Go语言中,性能测试(基准测试)与功能测试共用一套工具链:go test命令行工具和testing标准库,无需额外引入第三方工具即可完成全流程性能测试。
模块小结
本模块核心讲解了Go基准测试的定位与基础工具链,明确其属于非功能性测试,且复用Go原生测试工具,为后续实操奠定认知基础。
2.2 自动化性能测试编写与执行
2.2.1 核心问题
如何自动执行函数的性能测试?
2.2.2 实现方案
创建符合Go规范的基准测试函数,通过go test工具运行该函数。
2.2.3 实操步骤与原理
1. 待测试函数准备
以简单的Add函数为例,定义在普通Go文件中:
package test

func Add(a, b int) int {
    return a + b
}
2. 基准测试函数编写
在以_test.go结尾的文件(如benchmark_test.go)中编写基准测试函数,文件包名必须与待测试函数所在包名一致:
package test // 必须与 Add 函数所在的包名相同

import "testing"

func BenchmarkAdd(b *testing.B) { // 基准测试函数
    for i := 0; i < b.N; i++ {
        Add(1, 2)
    }
}
基准测试函数的核心规范:
- 函数名以
Benchmark开头,后续采用驼峰命名法描述测试内容; - 仅包含一个输入参数,类型为
*testing.B(用于管理计时、指定迭代次数,用法类似功能测试的*testing.T); - 函数主体为循环结构,循环次数由
b.N决定(测试框架自动调整,以获取稳定测量结果)。
3. 运行基准测试
使用go test配合-bench标志运行,.表示匹配所有基准测试函数:
% go test -bench=.
goos: darwin      # 操作系统为 macOS
goarch: arm64     # CPU 架构为 ARM64
pkg: github.com/sausheong/gocookbook/ch19_benchmarking
BenchmarkAdd-10  1000000000  0.4093 ns/op
PASS
ok      github.com/sausheong/gocookbook/ch19_benchmarking  0.907s
4. 测试结果解读
输出结果核心信息:
| 字段 | 说明 |
|---|---|
| goos/goarch | 测试运行的操作系统与CPU架构 |
| BenchmarkAdd-10 | 测试名(BenchmarkAdd)+ 使用的CPU核心数(10) |
| 1000000000 | 迭代总次数 |
| 0.4093 ns/op | 每次操作(本例中为执行Add函数)的平均耗时 |
5. 结果稳定性验证
单次测试结果可能受环境影响波动,可通过-count指定多次运行:
% go test -bench=. -count=5
goos: darwin
goarch: arm64
pkg: github.com/sausheong/gocookbook/ch19_benchmarking
BenchmarkAdd-10  1000000000  0.4106 ns/op
BenchmarkAdd-10  1000000000  0.4100 ns/op
BenchmarkAdd-10  1000000000  0.4099 ns/op
BenchmarkAdd-10  1000000000  0.4108 ns/op
BenchmarkAdd-10  1000000000  0.4096 ns/op
PASS
ok      github.com/sausheong/gocookbook/ch19_benchmarking  2.451s
模块小结
本模块完整讲解了自动化基准测试的编写规范、运行方式与结果解读,核心是遵循Benchmark开头的函数命名规范,利用b.N控制迭代次数,通过go test -bench运行测试,并可通过-count提升结果稳定性。
2.3 精准控制性能测试执行范围
2.3.1 核心问题
如何只运行性能测试,而不运行功能测试?
2.3.2 实现方案
利用-run标志设置不匹配任何功能测试的过滤条件,过滤掉功能测试仅执行基准测试。
2.3.3 实操与原理
1. 场景背景
当_test.go文件中同时包含功能测试(如TestAdd)和基准测试时,默认运行go test -bench=.会先执行所有功能测试:
func TestAdd(t *testing.T) { // 功能测试函数
    result := Add(1, 2)
    if result != 3 {
        t.Error("Adding 1 and 2 doesn't produce 3")
    } else {
        t.Log("Adding 1 and 2 results in", result)
    }
}
运行结果会包含功能测试输出:
% go test -v -bench=.
=== RUN   TestAdd
--- PASS: TestAdd (0.00s)
    benchmark_test.go:16: Adding 1 and 2 results in 3
goos: darwin
goarch: arm64
pkg: github.com/sausheong/gocookbook/ch19_benchmarking
BenchmarkAdd-10  1000000000  0.4099 ns/op
PASS
ok      github.com/sausheong/gocookbook/ch19_benchmarking  0.901s
2. 仅运行基准测试的方法
通过-run指定无匹配的过滤条件(如XXX),过滤所有功能测试:
% go test -v -bench=. -run=XXX
goos: darwin
goarch: arm64
pkg: github.com/sausheong/gocookbook/ch19_benchmarking
BenchmarkAdd-10  1000000000  0.4109 ns/op
PASS
ok      github.com/sausheong/gocookbook/ch19_benchmarking  0.634s
模块小结
本模块核心解决了功能测试与基准测试混存时的执行范围控制问题,关键是利用-run标志设置无效过滤条件,仅保留基准测试执行流程。
2.4 规避测试夹具的性能干扰
2.4.1 核心问题
如何自定义性能测试,避免测试夹具(Test Fixture)的初始化操作被计入基准测试耗时?
2.4.2 实现方案
使用testing.B的StartTimer、StopTimer、ResetTimer方法控制计时器,灵活排除非核心逻辑的耗时。
2.4.3 实操案例(图片翻转函数测试)
1. 待测试函数(图片翻转)
// 翻转图片
func flip(grid [][]color.Color) {
    for x := 0; x < len(grid); x++ {
        col := grid[x]
        for y := 0; y < len(col)/2; y++ {
            k := len(col) - y - 1
            col[y], col[k] = col[k], col[y]
        }
    }
}
2. 未规避夹具的基准测试(含问题)
测试夹具为加载PNG文件到网格,该操作被计入耗时:
func BenchmarkFlip(b *testing.B) {
    grid := load("monalisa.png") // 性能测试包含了加载 PNG 文件的耗时
    for i := 0; i < b.N; i++ {
        flip(grid)
    }
}
运行结果(包含加载耗时):
% go test -v -bench=Flip -run=XXX
goos: darwin
goarch: arm64
pkg: github.com/sausheong/gocookbook/ch19_benchmarking
BenchmarkFlip-10  6492  184067 ns/op
PASS
ok  github.com/sausheong/gocookbook/ch19_benchmarking  1.538s
3. 全局夹具规避(ResetTimer)
加载完成后重置计时器,排除一次性夹具耗时:
func BenchmarkFlip(b *testing.B) {
    grid := load("monalisa.png")
    b.ResetTimer() // 重置计时器,忽略加载图片的耗时
    for i := 0; i < b.N; i++ {
        flip(grid)
    }
}
运行结果(仅统计翻转耗时):
% go test -v -bench=Flip -run=XXX
goos: darwin
goarch: arm64
pkg: github.com/sausheong/gocookbook/ch19_benchmarking
BenchmarkFlip-10  6618  181478 ns/op
PASS
ok  github.com/sausheong/gocookbook/ch19_benchmarking  2.338s
4. 迭代内夹具规避(StopTimer/StartTimer)
若夹具需在每次迭代执行(如每次加载图片),通过启停计时器排除:
// 未规避版本
func BenchmarkLoadAndFlip(b *testing.B) {
    for i := 0; i < b.N; i++ {
        grid := load("monalisa.png")
        flip(grid)
    }
}
// 运行结果(含加载耗时)
// % go test -v -bench=LoadAndFlip -run=XXX
// goos: darwin
// goarch: arm64
// pkg: github.com/sausheong/gocookbook/ch19_benchmarking
// BenchmarkLoadAndFlip-10  69  14613379 ns/op
// PASS
// ok  github.com/sausheong/gocookbook/ch19_benchmarking  1.232s

// 规避版本
func BenchmarkLoadAndFlip(b *testing.B) {
    for i := 0; i < b.N; i++ {
        b.StopTimer()            // 停止计时器,忽略加载图像的耗时
        grid := load("monalisa.png")
        b.StartTimer()           // 启动计时器,记录翻转图像的耗时
        flip(grid)
    }
}
// 运行结果(仅统计翻转耗时)
// % go test -v -bench=LoadAndFlip -run=XXX
// goos: darwin
// goarch: arm64
// pkg: github.com/sausheong/gocookbook/ch19_benchmarking
// BenchmarkLoadAndFlip-10  1540  672674 ns/op
// PASS
// ok  github.com/sausheong/gocookbook/ch19_benchmarking  23.672s
避坑指南
ResetTimer适用于一次性夹具(如测试前加载一次资源),StopTimer/StartTimer适用于迭代内重复执行的夹具;- 即使排除了夹具耗时,若夹具本身执行缓慢,仍会导致测试总耗时增加(如上述案例总耗时24秒)。
模块小结
本模块核心讲解了通过ResetTimer/StopTimer/StartTimer控制计时器,精准排除测试夹具的耗时干扰,不同方法适配不同夹具执行场景,需根据实际情况选择。
2.5 调整基准测试运行时长/迭代次数
2.5.1 核心问题
如何控制性能测试的运行时长或迭代次数?
2.5.2 实现方案
使用-benchtime标志指定基准测试的最小运行时长,或直接指定迭代次数。
2.5.3 实操与原理
1. 默认行为
Go测试框架会自动调整b.N,使基准测试默认运行约1秒钟(仅统计核心逻辑耗时)。
2. 指定运行时长
通过-benchtime=时长缩短/延长测试运行时长,示例:
% go test -v -bench=LoadAndFlip -run=XXX -benchtime=100ms
goos: darwin
goarch: arm64
pkg: github.com/sausheong/gocookbook/ch19_benchmarking
BenchmarkLoadAndFlip-10  226  687917 ns/op
PASS
ok github.com/sausheong/gocookbook/ch19_benchmarking 4.789s注意:benchtime为最小运行时间,实际耗时可能略高于指定值。
3. 指定迭代次数
通过-benchtime=Nx格式固定迭代次数(N为具体数值),示例:
% go test -v -bench=LoadAndFlip -run=XXX -benchtime=100x
goos: darwin
goarch: arm64
pkg: github.com/sausheong/gocookbook/ch19_benchmarking
BenchmarkLoadAndFlip-10  100  712695 ns/op
PASS
ok  github.com/sausheong/gocookbook/ch19_benchmarking  1.932s
模块小结
本模块核心讲解了通过-benchtime灵活控制基准测试的运行时长或迭代次数,可根据测试需求(如快速验证、精准统计)选择不同参数形式。
2.6 表驱动式多测试用例设计(子基准测试)
2.6.1 核心问题
如何像功能测试的表驱动测试一样,运行多个基准测试用例?
2.6.2 实现方案
创建子基准测试,为每个测试用例独立运行子基准测试(Go 1.7+支持)。
2.6.3 实操案例(斐波那契函数测试)
1. 待测试函数(递归斐波那契)
func fibonacci(n int) int {
    if n <= 1 {
        return n
    }
    return fibonacci(n-1) + fibonacci(n-2)
}
2. 单例基准测试(对比用)
func BenchmarkFibonacci5(b *testing.B) {
    for i := 0; i < b.N; i++ {
        fibonacci(5)
    }
}
// 运行结果
// % go test -run=XXX -bench=Fibonacci5
// goos: darwin
// goarch: arm64
// pkg: github.com/sausheong/gocookbook/ch19_benchmarking
// BenchmarkFibonacci5-10  43522675  27.53 ns/op
// PASS
// ok  github.com/sausheong/gocookbook/ch19_benchmarking  1.836s
3. 表驱动子基准测试
func BenchmarkFibonacciWithSubBenchmark(b *testing.B) {
    testCases := []struct {
        name string
        n    int
    }{
        {"Fibonacci-1", 1},
        {"Fibonacci-5", 5},
        {"Fibonacci-10", 10},
        {"Fibonacci-20", 20},
        {"Fibonacci-30", 30},
    }
    for _, testCase := range testCases {
        testCase := testCase // 避免闭包引用问题
        b.Run(testCase.name, func(b *testing.B) {
            for i := 0; i < b.N; i++ {
                fibonacci(testCase.n)
            }
        })
    }
}
运行结果:
% go test -run=XXX -bench=SubBenchmark
goos: darwin
goarch: arm64
pkg: github.com/sausheong/gocookbook/ch19_benchmarking
BenchmarkFibonacciWithSubBenchmark/Fibonacci-1-10    440615576  2.735 ns/op
BenchmarkFibonacciWithSubBenchmark/Fibonacci-5-10    42677919  27.86 ns/op
BenchmarkFibonacciWithSubBenchmark/Fibonacci-10-10   3598915  332.4 ns/op
BenchmarkFibonacciWithSubBenchmark/Fibonacci-20-10     29084  41173 ns/op
BenchmarkFibonacciWithSubBenchmark/Fibonacci-30-10      236  5069878 ns/op
PASS
ok  github.com/sausheong/gocookbook/ch19_benchmarking  8.161s
避坑指南
子基准测试中需注意闭包引用问题,需在循环内重新赋值testCase,避免所有子测试引用最后一个用例。
模块小结
本模块核心讲解了基于子基准测试实现表驱动的多场景基准测试,可一次性验证不同输入参数下的函数性能,提升测试效率。
2.7 性能测试结果对比分析(benchstat)
2.7.1 核心问题
如何比较性能测试结果,判断代码更改是否带来性能改进?
2.7.2 实现方案
使用benchstat工具分析多次测试结果,对比不同版本代码的性能差异。
2.7.3 实操与原理
1. 工具安装
% go install golang.org/x/perf/cmd/benchstat@latest2. 单版本结果统计(以图片翻转为例)
Step 1:运行10次测试并保存结果
% go test -bench=BenchmarkFlip -run=XXX -count=10 > flip.txt结果示例:
goos: darwin
goarch: arm64
pkg: github.com/sausheong/gocookbook/ch19_benchmarking
BenchmarkFlip-10  6543  182126 ns/op
BenchmarkFlip-10  6532  182625 ns/op
BenchmarkFlip-10  6614  181799 ns/op
BenchmarkFlip-10  6606  181278 ns/op
BenchmarkFlip-10  6547  182261 ns/op
BenchmarkFlip-10  6600  181419 ns/op
BenchmarkFlip-10  6607  181435 ns/op
BenchmarkFlip-10  6583  184046 ns/op
BenchmarkFlip-10  6540  184130 ns/op
BenchmarkFlip-10  6562  181718 ns/op
PASS
ok  github.com/sausheong/gocookbook/ch19_benchmarking  14.707s
Step 2:用benchstat分析结果
% benchstat flip.txt
name   time/op
Flip-10  182µs ± 1%
结果解读:平均耗时182微秒,误差±1%(误差≤5%为可接受范围,超过需重新测试)。
3. 多版本结果对比(JSON序列化示例)
场景:对比json.Marshal与json.Encoder的性能
Step 1:准备测试数据与基准测试函数
var jsonString string = `{"name":"Han Solo","height":"180","mass":"80","hair_color":"brown","skin_color":"fair","eye_color":"brown","birth_year":"29BBY","gender":"male","homeworld":"https://swapi.dev/api/planets/22/","films":["https://swapi.dev/api/films/1/","https://swapi.dev/api/films/2/","https://swapi.dev/api/films/3/"],"species":[],"vehicles":[],"starships":["https://swapi.dev/api/starships/10/","https://swapi.dev/api/starships/22/"],"created":"2014-12-10T16:49:14.582Z","edited":"2014-12-20T21:17:50.334Z","url":"https://swapi.dev/api/people/14/"}`
var jsonBytes []byte = []byte(jsonString)
var person Person

// json.Marshal 基准测试
func BenchmarkWrite(b *testing.B) {
    json.Unmarshal(jsonBytes, &person) // 初始化结构体
    b.ResetTimer() // 重置计时器,忽略初始化耗时
    for i := 0; i < b.N; i++ {
        data, _ := json.Marshal(person)
        io.Discard.Write(data) // 避免写入磁盘的开销
    }
}

// json.Encoder 基准测试(替换上述函数后运行)
func BenchmarkWrite(b *testing.B) {
    json.Unmarshal(jsonBytes, &person)
    b.ResetTimer()
    encoder := json.NewEncoder(io.Discard)
    for i := 0; i < b.N; i++ {
        encoder.Encode(person)
    }
}
Step 2:分别运行测试并保存结果
# Marshal版本
% go test -bench=Write -run=XXX -count=10 > marshal.txt
# Encoder版本
% go test -bench=Write -run=XXX -count=10 > encode.txt
Step 3:对比结果
% benchstat marshal.txt encode.txt
name     old time/op  new time/op  delta
Write-10  2.16µs ± 1%  2.10µs ± 0%  -2.49% (p=0.000 n=10+10)
结果核心解读:
| 字段 | 说明 |
|---|---|
| old time/op | 旧版本(Marshal)平均耗时2.16µs,误差±1% |
| new time/op | 新版本(Encoder)平均耗时2.10µs,误差可忽略 |
| delta | 性能变化量,-2.49%表示新版本比旧版本快2.49% |
| p | 统计显著性(p<0.05为有统计显著性) |
| n | 有效样本数(10+10表示两个测试各10个有效样本,不足90%需重新测试) |
模块小结
本模块核心讲解了benchstat工具的使用,包括单版本结果统计与多版本性能对比,可量化判断代码更改对性能的影响,核心关注delta与p值的解读。
2.8 程序CPU性能剖析(pprof)
2.8.1 核心问题
如何了解函数或程序的CPU时间消耗,定位性能瓶颈?
2.8.2 实现方案
使用Go内置的pprof工具(配合runtime/pprof包)进行CPU性能剖析,统计各函数的CPU耗时分布。
2.8.3 核心原理
CPU性能剖析的核心逻辑:启用剖析后,Go运行时每10毫秒中断一次,记录当前函数调用堆栈,通过统计堆栈样本分布,分析各函数的CPU耗时占比。
2.8.4 实操案例(图片缩放函数剖析)
1. 待测试函数(图片缩放)
func resize(grid [][]color.Color, scale float64) (resized [][]color.Color) {
    xlen, ylen := int(float64(len(grid))*scale), int(float64(len(grid[0]))*scale)
    resized = make([][]color.Color, xlen)
    for i := 0; i < len(resized); i++ {
        resized[i] = make([]color.Color, ylen)
    }
    for x := 0; x < xlen; x++ {
        for y := 0; y < ylen; y++ {
            xp := int(math.Floor(float64(x) / scale))
            yp := int(math.Floor(float64(y) / scale))
            resized[x][y] = grid[xp][yp]
        }
    }
    return
}

// 辅助函数:加载/保存图片
func load(filePath string) (grid [][]color.Color) {
    file, err := os.Open(filePath)
    if err != nil {
        log.Println("Cannot read file:", err)
    }
    defer file.Close()
    img, _, err := image.Decode(file)
    if err != nil {
        log.Println("Cannot decode file:", err)
    }
    size := img.Bounds()
    for i := 0; i < size.Max.X; i++ {
        var y []color.Color
        for j := 0; j < size.Max.Y; j++ {
            y = append(y, img.At(i, j))
        }
        grid = append(grid, y)
    }
    return
}

func save(filePath string, grid [][]color.Color) {
    xlen, ylen := len(grid), len(grid[0])
    rect := image.Rect(0, 0, xlen, ylen)
    img := image.NewRGBA(rect)
    for x := 0; x < xlen; x++ {
        for y := 0; y < ylen; y++ {
            img.Set(x, y, grid[x][y])
        }
    }
    file, err := os.Create(filePath)
    if err != nil {
        log.Println("Cannot create file:", err)
    }
    defer file.Close()
    png.Encode(file, img.SubImage(img.Bounds()))
}
2. 剖析方法一:通过go test生成剖析文件
Step 1:编写基准测试函数
func BenchmarkResize(b *testing.B) {
    for i := 0; i < b.N; i++ {
        grid := load("monalisa.png")
        resized := resize(grid, 3.0)
        save("resized.png", resized)
    }
}
Step 2:运行测试并生成CPU剖析文件
% go test -cpuprofile cpu.prof -bench=Resize -run=XXX
goos: darwin
goarch: arm64
pkg: github.com/sausheong/gocookbook/ch19_benchmarking
BenchmarkResize-10  6  181341944 ns/op
PASS
ok github.com/sausheong/gocookbook/ch19_benchmarking 1.928s生成cpu.prof二进制剖析文件。
3. 剖析方法二:代码中集成剖析(第三方包简化)
使用github.com/pkg/profile包简化剖析代码:
import (
    "github.com/pkg/profile"
)

func main() {
    defer profile.Start(profile.CPUProfile, profile.ProfilePath(".")).Stop()
    grid := load("monalisa.png")
    resized := resize(grid, 3.0)
    save("resized.png", resized)
}编译运行后生成cpu.pprof文件(无测试框架开销)。
4. 剖析文件分析(pprof Web界面)
Step 1:安装Graphviz(可视化依赖)
- macOS:
brew install graphviz - Windows:从https://graphviz.org/download/下载安装
- Linux(Debian/Ubuntu):
sudo apt install graphviz
Step 2:启动pprof Web界面
% go tool pprof -http localhost:8080 cpu.prof
Serving web UI on http://localhost:8080
Step 3:核心视图解读
图形视图
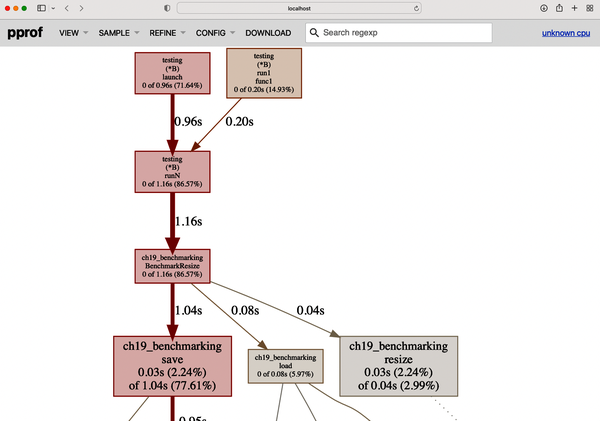 核心信息:
核心信息:testing.B占86% CPU时间,BenchmarkResize中77%耗时在save函数(图片编码)、6%在load(图片解码)、仅3%在resize本身。火焰图视图
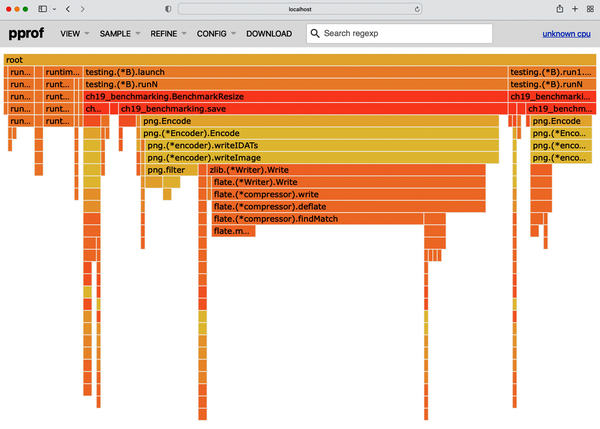 核心信息:水平条形展示调用栈层级,可点击条形展开详情,清晰呈现多次迭代的耗时分布。
单次迭代火焰图
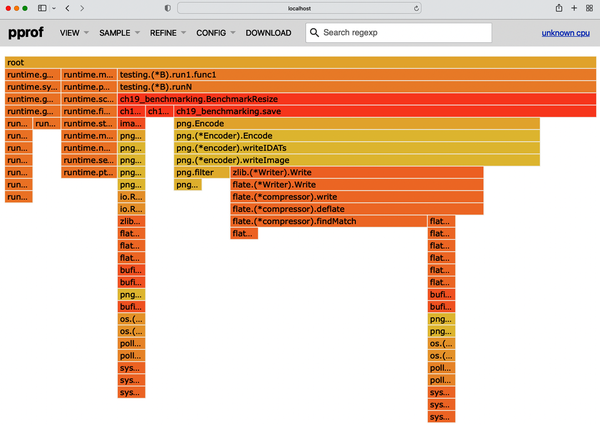 核心信息:仅展示一次
BenchmarkResize调用的耗时分布,便于聚焦单次执行的瓶颈。源码视图
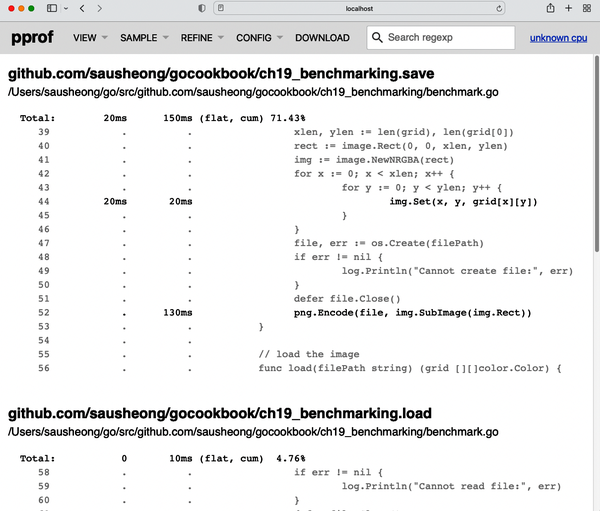 核心信息:定位到具体耗时代码行,精准指导优化方向。
5. 两种剖析方法对比
go test生成的剖析文件包含测试框架开销,代码集成方式无框架开销;- 核心函数的耗时比例一致,仅整体耗时分布略有差异。
模块小结
本模块核心讲解了pprof工具的使用方法,包括剖析文件生成(测试工具/代码集成)、可视化分析(多视图解读),可精准定位CPU性能瓶颈,是代码性能优化的核心工具。
【本篇核心知识点速记】
- 基准测试基础:函数名以
Benchmark开头,参数为*testing.B,通过go test -bench运行,b.N由框架自动调整; - 测试范围控制:
-run=无效值可过滤功能测试,仅运行基准测试; - 夹具规避:
ResetTimer(一次性夹具)、StopTimer/StartTimer(迭代内夹具)排除非核心耗时; - 运行控制:
-benchtime可指定运行时长(如100ms)或迭代次数(如100x); - 多用例测试:Go 1.7+支持子基准测试,通过
b.Run实现表驱动多场景测试; - 结果对比:
benchstat工具可统计单次测试结果、对比多版本性能,核心关注delta(性能变化)和p值(统计显著性); - 性能剖析:
pprof工具可生成CPU剖析文件,通过图形/火焰图/源码视图定位性能瓶颈,两种生成方式(测试工具/代码集成)适配不同场景。